35%of the Green Belt the city would remove is in S13
S13 holds about 5% of Sheffield's Green Belt but takes about 35% of the city's removal. The west and south-west of the city lose almost none. See how every postcode compares.
91.7 hectaresof Green Belt allocated for development on the edge of Handsworth.
Two sites, Handsworth Hall Farm (SES29) and Bramley Common (SES30), together roughly the size of Graves Park. Both lie inside one area of about four square kilometres.
The 29% figure spreads a local loss across a whole postcode
On 26 October a briefing sent to all councillors on behalf of the Head of Planning said Green Belt in Sheffield's part of S13 would fall from 469.49 to 335.60 hectares: a loss of 133.9 hectares, or about 29%. The Council repeated the figure to The Star.
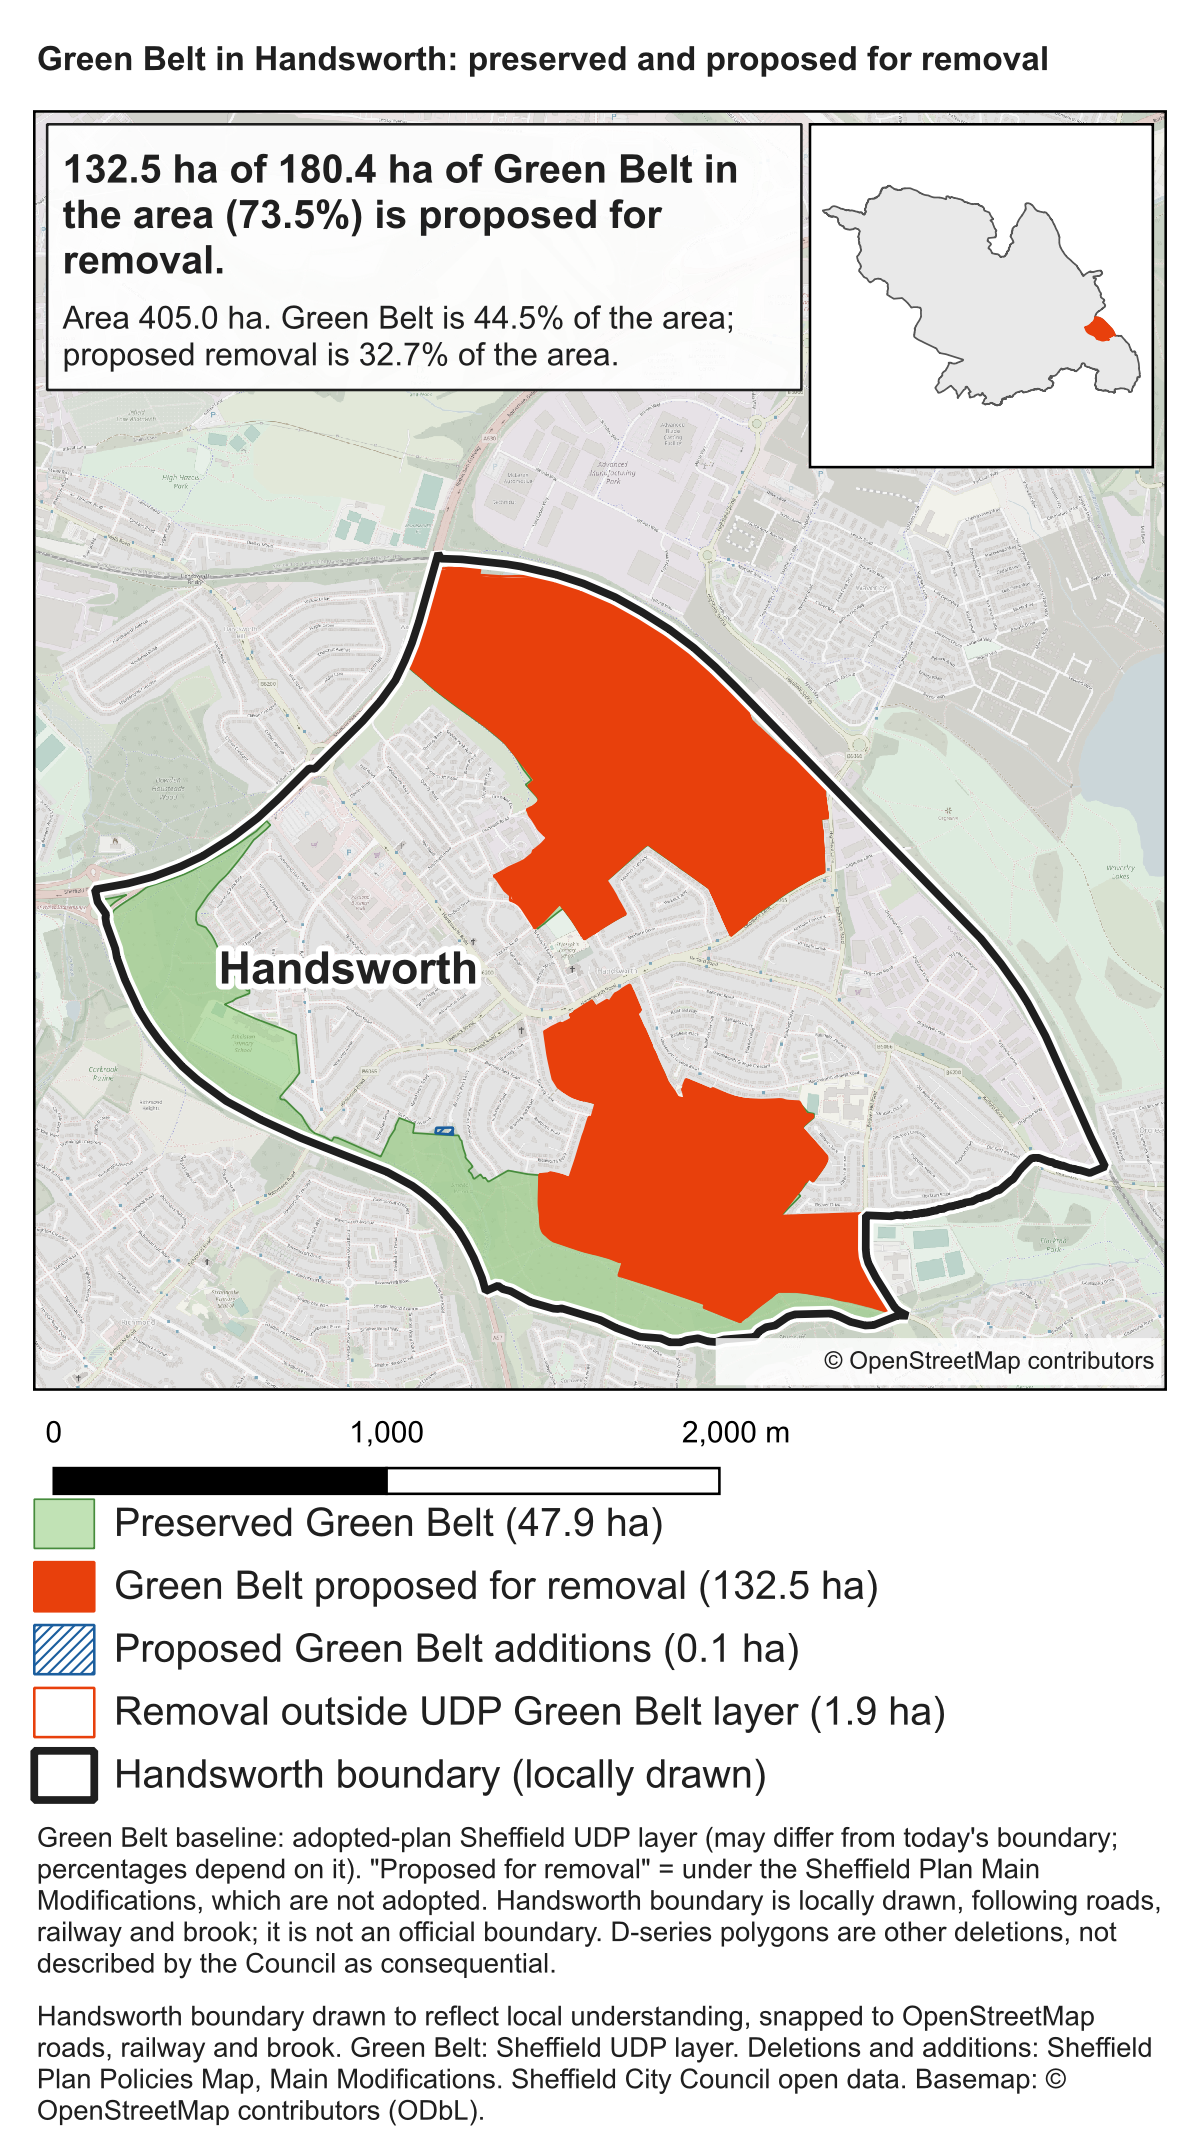
Our map shows 132.5 hectares proposed for removal inside the area outlined in black. Almost all of S13's loss falls in this one area. The Council reaches 29% by dividing that loss by all of S13's Green Belt, including 335.6 hectares that would be kept, most of it elsewhere in the postcode.
Green Belt kept elsewhere in S13 does not replace the loss in Handsworth, or make it any easier for people here to reach.
Green Belt proposed for removal, by the area it is measured against
Area measured
Green Belt now
Proposed for removal
Share removed
Sheffield (our analysis)
9,076.3 ha
380.3 ha
4.2%
Sheffield's part of S13 (Council)
469.5 ha
133.9 ha
29%
Handsworth area on our map
180.4 ha
132.5 ha
73.5%
Each figure is arithmetically correct. In the bottom two rows the S13 loss is almost the same land; only the area it is divided by changes. A postcode total answers a question about the postcode. It does not show councillors where the loss would fall, and the Council has not given them that figure.
S13 carries the heaviest share in Sheffield
We measured the Council's own Main Modifications map against every Sheffield postcode district. No other postcode would lose so large a share of its Green Belt.
Share of each postcode's Green Belt proposed for removal
S13 Handsworth, Woodhouse29%
S12, S14 Gleadless15%
S9 Darnall, Tinsley14%
S35, S5 Chapeltown, Ecclesfield6%
S10 Crookes, Lodge Moor1.4%
S6 Hillsborough, Stannington0.8%
S11 Ecclesall0.4%
S17 Dore, Totley0.4%
S7, S8, S20, S360%
The thin line marks Sheffield as a whole: 4.2%.
S13 alone would lose almost five times as much Green Belt as the west and south-west of the city combined. S6, S7, S8, S10, S11 and S17 hold about 3,900 hectares of Green Belt between them. About 28 hectares would be removed: under 1%.
The north of the city, around Chapeltown, Ecclesfield and Grenoside, would lose slightly more hectares than S13: about 154. It holds about 2,500 hectares of Green Belt, so that is about 6% of what it has.
Per person
A postcode can lose a large share of a small amount. That is not what is happening in S13. Before the Plan, S13 had about as much Green Belt per resident as the Sheffield average. Afterwards it would have about a third less than the city average, while the west and south-west would keep almost all of theirs.
Green Belt per resident, now and after the Plan (square metres) Now After the Plan
S13151 → 108
Sheffield164 → 157
West and south-west S6, S7, S8, S10, S11, S17179 → 178
North S35, S5241 → 226
Residents: Census 2021. S13 uses the Council's Green Belt figures.
Each S13 resident would lose about 43 square metres of Green Belt. In the west and south-west, each resident would lose just over 1.
Some largely built-up postcodes, such as S7, S8 and S9, have less Green Belt per person than S13 would have afterwards, because they had little to begin with. What sets S13 apart is how much would be taken.
Show the figures
Green Belt by postcode district, before and after the Main Modifications
Postcode
Green Belt now
Proposed for removal
Share removed
S13 (Council figures)
469.5 ha
133.9 ha
29%
S12 and S14
281.1 ha
41.4 ha
15%
S9
126.9 ha
17.2 ha
14%
S35 and S5
2,503.5 ha
153.8 ha
6%
S10
673.4 ha
9.3 ha
1.4%
S6
1,739.2 ha
13.1 ha
0.8%
S11
658.8 ha
2.7 ha
0.4%
S17
604.7 ha
2.7 ha
0.4%
S7, S8, S20, S36
2,065.3 ha
0.2 ha
0%
Sheffield
9,142.4 ha
386.4 ha
4.2%
Green Belt per resident, in square metres
Area
Residents (2021)
Now
After the Plan
Removed per resident
S13 (Council figures)
31,052
151
108
43
S12 and S14
43,926
64
55
9.4
S9
29,041
44
38
5.9
S35 and S5
104,070
241
226
15
West and south-west
218,770
179
178
1.3
Sheffield
556,500
164
157
6.9
Over 90 hectares of development in one small area
Most of the land removed around Handsworth would not become protected greenspace. It is allocated for development:
Handsworth Hall Farm (SES29): 56.4 hectares, for 870 homes and 20 hectares of employment land.
Bramley Common (SES30): 35.28 hectares, for 827 homes, with land safeguarded for a secondary school and a burial ground.
Together the two sites would take 1,697 homes: about 43% of the homes planned on Sheffield's 11 Green Belt housing sites.
On the same baseline as our map, this area holds 2.0% of Sheffield's Green Belt but would take 34.8% of all the Green Belt the city proposes to remove: about one hectare in every three.
The Council's citywide figures describe the city, not Handsworth
In its response to The Star, the Council said the Inspectors had concluded that "a small number" of Green Belt sites are needed, that around 80% of new homes would be on brownfield land, and that the Green Belt development sites represent around 3.5% of Sheffield's Green Belt.
Like the 29%, those figures may be correct. None of them shows where the loss falls. A small citywide share can still land heavily on one community. Here it means 1,697 homes on two Green Belt sites, adding traffic to the same roads and demand on the same schools and GP surgeries. Our site-visit briefings set out the Council's own evidence on traffic and services.
Urban Green Space cannot protect land allocated for housing
The Council told councillors that some land removed from the Green Belt would become Urban Green Space Zones and so be "protected from development". That reassurance cannot apply to the 91.7 hectares allocated for development. On these figures, it could cover at most about 40 of the 132.5 hectares removed around Handsworth.
For that land, Green Belt would be replaced by a local designation. Green Belt boundaries can only be changed where exceptional circumstances are fully evidenced and justified. A future Local Plan could change an Urban Green Space Zone without meeting that test. Proposed Policy GS1 (pages 110–111) also allows greenspace to be lost where it is assessed as surplus to requirements, or where equivalent or better replacement space is provided elsewhere.
If the Council intends to protect these places, why has it not proposed them as Local Green Space? That designation is backed by national planning policy and protects land on terms consistent with Green Belt. The Council has not explained its choice.
The 96% figure
The Council's response to The Star challenged a reported claim that S13 would lose 96% of its Green Belt. Our analysis does not support 96% for S13 as a whole, and we do not use it. Our figure is 73.5%, for the area on the map, and the working is in the CSV above.
Correcting a postcode figure does not answer the local one. The Council has not said how much of its 133.9 hectares lies around Handsworth. It holds the data to do so.
What councillors should ask before they vote
Explain why S13 takes about 35% of the city's Green Belt removal, while the west and south-west of the city lose under 1%.
Publish the map and boundary behind the 469.49 and 335.60 hectare figures, so the calculation can be checked.
Give the Green Belt loss for the area around Handsworth, and for Woodhouse and Richmond wards.
Split the 133.9 hectares into land allocated for development and land becoming Urban Green Space.
Explain why Urban Green Space was chosen over Local Green Space.
Councillors who vote for the Plan will be approving where this loss falls. They should have the local figures before they vote, and the Council can provide them.
How these figures were calculated
Within the mapped area, 132.5 of 180.4 hectares of Green Belt is proposed for removal: 73.5%, leaving 47.9 hectares.
The black line was drawn to reflect the place residents know as Handsworth. It follows the railway, Sheffield Parkway, the A57, Shirtcliff Brook and Beaver Hill Road, and lies mainly within Woodhouse and Richmond wards. It encloses 405 hectares. It is not an official boundary. Moving the line would change the percentage; it would not move the two sites.
The figures overlay the Council's adopted UDP Green Belt layer with Main Modifications Policies Map deletions. Overlapping land is counted once; areas use British National Grid. The UDP baseline may differ slightly from today's boundary. The CSV separately records 1.9 hectares of deletions outside the UDP layer and 0.1 hectares of proposed additions. The Council's 133.9-hectare S13 figure uses a different boundary, and the two calculations have not been reconciled.
Site areas are the published gross areas in MM410 and MM411 (56.40 + 35.28 = 91.68 hectares). The 43% is 1,697 of 3,906 homes on the 11 additional Green Belt housing sites. Graves Park's charitable land covers 90.27 hectares (Council report, 23 July 2025, paragraph 1.4).
Our Sheffield row counts all mapped Green Belt deletions. The Council's 3.5% headline counts development sites only, so the two differ.
The postcode comparison uses the Council's Main Modifications Policies Map: the Green Belt zone after the changes, and the layers showing land removed from and added to the Green Belt. On that basis Sheffield has 9,142.4 hectares of Green Belt, and 386.4 hectares would be removed (4.2%). This differs slightly from the UDP layer used for our map, which gives the same 4.2%. The 5% is 469.5 of 9,142.4 hectares; the 35% is 133.9 of 386.4 hectares.
There is no official open boundary for postcode districts, so we used the boundaries published with Wikipedia's list of postcode districts. They are approximate. Our S13 removal (133.5 hectares) matches the Council's 133.9, but our S13 boundary holds less Green Belt (424.1 hectares against the Council's 469.5), so for S13 we quote the Council's figures; our own estimate is 31%. Where the boundary data splits sites between neighbouring districts we have combined them: S12 with S14, and S35 with S5 and the Sheffield fringe of S61. Small Sheffield fringes of other districts, including 12.6 hectares removed in a strip labelled S60 on the Rotherham boundary, are not shown separately. Shares are rounded.
Population figures are Census 2021 usual residents by postcode district (Nomis, table P004). They cover whole postcode districts, including small parts outside Sheffield. S36 is left out of the per-person figures because much of it is in Barnsley. Sheffield's population is the Census 2021 figure of 556,500. The per-person figures for S13 use the Council's Green Belt figures; with our own S13 boundary, S13 starts at 137 square metres per resident, still close to the Sheffield average.